Search Results for: violinplot

Bleistift HQ’s failed attempt to improve paper testing

Earlier this year I tried to reduce the human element that is part of my pen and paper tests, e.g. those tests with violin plots. The aim was to make these tests more accurate and reproducible. Plotters are expensive, so I thought I try the :Move mini, an add-on for the micro:bit.

The micro:bit is a small ‘computer’, half the size of a credit card and is used in computer education in the UK. The :Move mini is a robot with two wheels that can be controlled by the micro:bit and that comes with a pen holder.

When I programmed the :Move mini I found it quite difficult to get it to draw a straight line and to have the same reproducible movements on paper, so I contacted the manufacturer Kitronik. Michael Lockhart, who works for their customer service got back to me and asked me to send my :MOVE mini in.

You might have seen this video on my YouTube Channel a few months go.

He told me that they

performed tests at a range of speeds, running at full speed the buggy runs straight and doesn’t suffer with one wheel turning at a different rate. You can reduce the speed to slow the buggy, however the more you slow the speed the more likely the buggy is going to drift to one side. Unfortunately this isn’t a fault with the buggy and more with the way the micro:bit is coded.

By using PWM you define how long you want the pulse to be and the gap between this pulse, as the micro:bit isn’t real time, this causes a slight differences in what the two pins are being told, and this always remains with the same pin. As such this results in one of the pins receiving a slightly different pulse to the other and as such at slow speeds there will be a drift. We had this set to pin 1 at 80 and pin 2 at 100, this is obviously just above/below the stop position for a 360 degree servo.

The longer the pulse is made the smaller the issues with the micro:bit is made, as such you may be able to counter out the issue with the micro:bit by setting the servo’s to half speed[…].

The bad news is that I can’t drive slowly or things go wrong, but if I drive fast things go wrong, too – see the video. Maybe if I could get rubber wheels for the :MOVE mini things would work better with higher speeds.

I also had a question regarding reproducibility as I was wondering whether the charge level of the battery will make a difference. Michael told me that..

In short yes that battery voltage would affect the servos, however it is a little more complex than that. So it works like this:
The servo board has a 3.3V regulator on it which then means the servos are provided with a constant voltage from the 4.5V battery pack. This means that the speed of the servos can be more accurate as when you use PWM you are varying the amount of voltage the servo’s are receiving for a given time. So while the combined voltage of the 3 batteries is between 3.3 and 4.5V the servos will run and you shouldn’t notice any change in there operation.

However once it drops below 3.3V’s the regulator will just pass the battery voltage straight through, this means that whatever the voltage is it will be passed to the micro:bit/Servos. This then means that the voltage that the servos will be provided with can alter and won’t be a regulated voltage. As such this could result in them operating slightly differently, this would normally affect the speed of the servos.

Well, it was interesting to find all these things out, but I am still not any closer to a reproducible pen and paper tester (with the use of a plotter, they cost £200 or more). I noticed that there are R2D2 toys that can draw lines. They are slightly cheaper than a plotter but still expensive.

I guess it might take another few years before I find a good solution…


Bleistift HQ’s failed attempt to improve paper testing Read More »

The Field Notes x Ingersoll notebooks

I think I read about the Ingersoll version of the Field Notes notebooks in the past, but I only really paid attention to them after Jinnie retweeted a tweet from ROY . Tempting. I had a quick look on the web, but wasn’t  able to find out what paper is being used for these ..and ordered anyway. BTW, Ingersoll is a watch company.

£9.95 or $9.95?

I can’t tell you what I paid yet. I’ll need to wait for the credit card bill. When I ordered it first said £9.95, then $9.95. the price has since been raised to £10. I then got an email telling me I got charged £8.29. I guess there’s a glitch in their online system.

£8.29?

The notebooks only took a few days to arrive. Here’s a little video.

Well, it turns out the paper in the Ingersoll is nearly the same as the paper in the original Field Notes: Finch Paper Opaque, but instead of 50#T “Bright White” it’s 60#T “Bright White” (Update: Mark Cohen let me know that this is the same paper as used in the Shenandoah notebooks). I think I like all other Field Notes papers I know more than the Finch Opaque, so this came as a bit of a disappointment.

Overall this is more or less a black version of the Original Field Notes, but the staples are white, the paper is thicker and also seems whiter and less yellow than Original. I am not sure whether I am imagining this, whether this is down to age, whether the paper change over time or whether this is down to ‘natural’ tolerances (both papers are called “Bright White” after all, so the same name implies they are the same colour.

There’s one way to find out: Check and compare the papers. As usual, I use R to do that (R is free). For a change I show you the commands I use.

To test it I followed the usual procedure explained here: The pencil lead used has a nominal diameter of 0.7mm and an actual diameter of 0.68mm (more info about nominal vs actual diameters can be found here). This is equivalent to a surface area of 0.36mm². A force of 1.5N is used, which, in this case, is equivalent to 4.17 MegaPascals for this surface area.

I convert the sample to numbers using this function.

greylist <- function(filename) {
 coloursample <- readTIFF(filename)
 greysample <- coloursample[,,1]+coloursample[,,2]+coloursample[,,3]
 greysample <- matrix(greysample, nrow = 1)
 #listsample <- as.list(greysample)
 #csvfilename = paste (filename, ".csv")
 #write.table(greysample, file = csvfilename, row.names=FALSE, col.names=FALSE, sep=)
 return(greysample)
}

I then put them together

data <- do.call(rbind, Map(data.frame, Mohawk=fnmohawk, Boise=fnboise, Finch_Fine=fnfinchfs, Finch_Opaque=fnfinchos,Finch_Inger=fnfinchinger, Domtar=fndomtar ))

and produce a violinplot

 vioplot2(data, names=c(  "Mohawk", "Boise", "Finch Fine",  "Finch Opaque", "F. Opaque Ing.", "Domtar"), col = "green")

vioplot is like the original violplot, but is not so demanding when it comes to how data is formatted [1]After comments on Facebook from Logan Lay and others I have changed to colour of the violin plots from the default magenta to green..

As you can see the 60#T Ingersoll paper is whiter as the violin plot starts higher (Y axis top is white, bottom is black), but lead leaves a darker line. This is so different for a paper that you’d expect to be more similar that I wanted to take a new sample in an old Original Field Notes with 50#T Finch Opaque paper. In the plot labelled as “Opaque 2”.

In the next plot this new sample is labelled “Opaque 2”.

Mean and quartiles of the new sample on old 50#T paper were more similar to the original sample than to the Ingersoll 60#T paper sample, but the tails are much longer, meaning that there is a small number of lighter and darker values at the extreme ends of the sample.

Top to Bottom (all Finch): Ingersoll 60#T, Original 50#T, Fine (Left is dark, right is light)

Why is that? I could think of many reasons. Hot candidates for the inconsistency (other than the paper) are the scanner (the bulb’s performance, differences after software updates), the way the pressure is applied or the consistency of the lead.

In the end, independent of which 50#T sample you look at, the 60#T paper used in the Ingersoll notebook still seems to be able to produce a darker line.

Let’s check whether there is a statistically significant difference between the different samples.

> TukeyHSD(results, conf.level = 0.95)
 Tukey multiple comparisons of means
 95% family-wise confidence level

Fit: aov(formula = darkness ~ paper, data = opaquecomparison)

$paper
                    diff        lwr         upr         p adj
 Opaque 1-Ingersoll  0.13578841  0.13236496  0.13921186  0
 Opaque 2-Ingersoll  0.10241369  0.09899024  0.10583715  0
 Opaque 2-Opaque 1  -0.03337472 -0.03679817 -0.02995127  0

The Tukey test puts into numbers what could already be seen earlier: the difference between the two 50#T samples’ means is quite small, even though they look different. The difference when comparing the Opaque 1 and the Opaque 2 sample to the Ingersoll sample is bigger (diff > 0.1).

When comparing the different papers with each other p is always so small that it is displayed as 0, so the differences between the different papers are significant. This doesn’t come as a surprise as the are different samples after all and as far as I understand Tukey isn’t really made to check whether the similarity between samples is coincidence or not.

A colleague (thanks Tatjana) showed me this way of visualising the difference:

> pl <- TukeyHSD(results, conf.level = 0.95)
> plot (pl)
Plot of the Tukey difference


The big question is: Can you create closer samples from the same paper if you have good enough equipment? …or is that just impossible, because the lead is not consistent and each sheet of paper is slightly different. I guess there is room to improve, but not with my simple means.

White staples

I don’t really know much about statistics. I normally don’t use statistics for my job, but have tried to learn R in the last years. If you have found any mistakes I would be happy if you let me know so that I can improve.

References

References
1 After comments on Facebook from Logan Lay and others I have changed to colour of the violin plots from the default magenta to green.

The Field Notes x Ingersoll notebooks Read More »

Lunatic Paper


lunarcoverThe next Field Notes edition, Black Ice, has already been announced, so posting this Lunacy review end of November means I’m a bit late to the party, but anyway: here’s a quick look at the paper used in the Lunacy edition, Domtar Earth Choice and a comparison with the best and the worst Field Notes paper I have used so far.


The Boise Paper (County Fair)

The Boise Offset Smooth 50#T “Whitewash” can be found in the Field Notes County Fair edition [1]More about this paper can be found in this blog post.


The Finch Paper (Original)

The Finch Paper Opaque Smooth 60#T “Bright White” that can be found in the original Field Notes was a disappointment. Graphite is quite light on this paper – I guess it would make good paper for soft leads, though. Ink, from fountain pens and even from gel pens, get sucked into the paper and is happy to bleed easily through the page …unless you have a very dry pen.

The new Black Ice edition will use Finch paper again, but this time “Bright White” Finch Fine Smooth 70# text paper. The description on Finch’s website sounds as if Finch Fine is better paper than Finch Opaque, but the information on the website is written for people printing on these papers, not handwriting on these papers, so for me, it remains to be seen whether Fine is better than Opaque. If you own the America the BeautifulFrost Gray or DDC Orange editions you have used Finch Fine in a different colour so you might be able to judge whether it is better for handwriting, drawing etc.


The Domtar Paper (Lunacy)

So here’s the ‘new’ Domtar paper. According to their website it’s “the largest family of environmentally responsible papers ever assembled” (not the most environmentally responsible papers ever assembled).

Looking at the Domtar website I think Domtar Earth Choice “Gray” 60#T with “Moondust Gray” must be the Earth Choice Colors Opaque Text, but I’m not 100% sure.

Looking at this Paper weights table I guess the 60# weight used for this paper must be equivalent to 90g/m².

domtar


The Test

The paper is tested using the same parameters as in previous paper tests and explained here. In short: The pencil lead used has a nominal diameter of 0.7mm and an actual diameter of 0.68mm (more info about nominal vs actual  diameters can be found here). This is equivalent to a surface area of 0.36mm². A force of 1.5N is used, which, in this case, is equivalent to 4.17 MegaPascals for this surface area.

3fns
Left to Right: Boise, Domtar, Finch

The violin plots show how dark the pencil marks left on the paper are. The general idea is that darker marks are easier to read and are therefore better. Darker marks result is violin plots that are lower positioned and black values would be low (near 0 on the y-axis (left)), while light marks are towards the top.

The Outcome

Well, it’s grey paper, so there’s no surprise when we see that the violin plot shows that Domtar’s ‘violin’ doesn’t get anywhere near the white value reached by Boise or Finch paper. If you look closely you can also see that the Boise paper is not as white as the Finch paper.

If you look closely at the marks left by graphite you can see that the paper will ‘shine’ through the line written on the paper as the roughness of the paper means that graphite isn’t left evenly on the mark left. This is where the paper colour for the test can be ‘picked up’ by the violin plot.

The Domtar paper doesn’t take graphite as well as Boise (County Fair) paper, but certainly better than Finch (Original/Kraft) paper. Because of the lower starting point, due to the greyness of the paper, overall ‘contrast’ isn’t however much better than the Finch paper.

I am happy to say that the Domtar paper behaves much better with ink than the Finch paper.

For pencils, there is better paper out there, e.g. Atoma, Banditapple or Silvine, but the paper quality is not the main attraction of the Field Notes anyway.

A violin plot comparing Boise, Domtar and Finch paper

The Links

If you like to read more about the Field Notes Lunacy edition have a look at Ed JelleyFountain Pen Follies,  OfficeSupplyGeek or Pens and Junk. For anything Field Notes related please visit Three Staples.

Update 25 Nov 2016: I just finished listening to The Pen Addict Podcast #232, where Brad and Myke give further insights into the paper used for different Field Notes. The question about Field Notes paper starts at 1:10:10. 


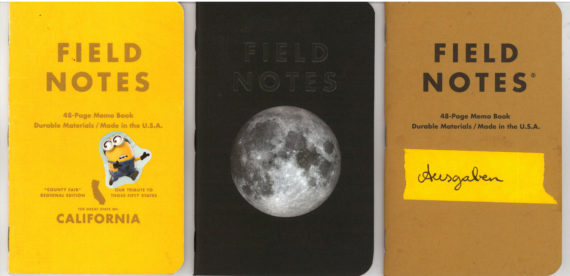
In case you wonder about how I use the Field Notes in the photo: The yellow County Fair contains notes from medical visits from our son, the Lunacy one isn’t being used yet, and in the Original one, labelled ‘Ausgaben’, I try to follow Sola’s example and try to keep notes of money spent.

Lunatic Paper Read More »