Christmas, as well as the New Year, are coming closer. It will be nice to have a few quiet days with less work, and no doubt many Bleistift readers will want to catch up with everyone’s favourite stationery podcast over the holidays.
It’s hard to believe that the Pen Addict podcast will be ten years old in 2022.
I thought I use this opportunity to update the Pen Addict ‘statistics’ I posted in preparation for the 300th episode. In 2018, at the time of that blog post the episodes got around five minutes longer per year and I made a tongue in cheek comment that that episode 1000 they should be more than two hours long. It’s a bit like the (infamous) forecast that in the future everyone will be an Elvis impersonator.
It shouldn’t come as a surprise that the rate of episode length increase wasn’t sustained over time. Below is the latest version of the diagram showing the episode length over time.
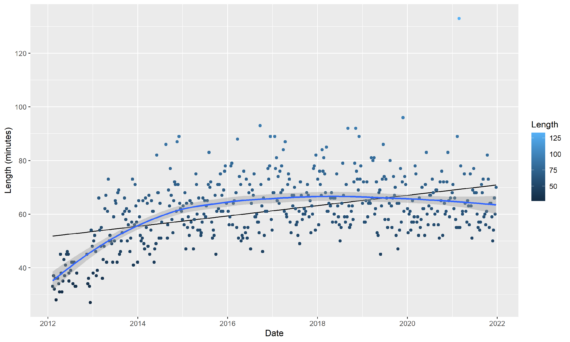
Each dot represents an episode. Early episodes are on the left, recent episodes are on the right. Short episodes are at the bottom, long episodes are at the top.
I marked the outliers on the image below. At the top right, in red, we got the longest ever episode, episode 450, clocking in at 133 minutes. At the bottom left we got episode 33, one of the few episodes with an episode number that is greater than its length in minutes (episode 46 is another one of those).
Please have a look at the Pen Addict Podcast page on stationery.wiki. You can easily sort all episodes, e.g. by length, by clicking on the little arrows in the header row and explore all episodes. We’d also be happy if you contribute to the other stationery knowledge recorded there. It’s a resource available to everyone.

You will have also noticed the more horizontal lines in the diagram. The black line is a straight linear regression line. The blue curve is a LOESS (local regression) curve, which is a bit more ‘flexible’ than the straight line.
In the image below you can see that in the first years (marked as ‘a’), until about 2015, we had a strong increase in episode lengths, mainly caused by the fact that early episodes were rather short. From then on, until about 2018 (marked as ‘b’) we had a very slow increase in episode lengths and since then (marked as ‘c’) we have a slow decrease in episode lengths. In the last few weeks he had an average length of about one hour per episode. The LOESS curve is moving (roughly) from 65 minutes per episode to 60 minutes per episode.

I hope you enjoy the holidays (if there holidays wherever you might be). If you have some time on your hands, please catch up with your favourite podcast and/or contribute to our stationery.wiki.
As usual, the data and the code used for this plot are available on GitHub. This time it is also available on kaggle.